Business Intelligence Reports & Dashboards
Business intelligence (BI) is software that ingests business data and presents it in user-friendly views such as reports, dashboards, charts and graphs. BI tools enable business users to access different types of data — historical and current, third-party and in-house, as well as semi-structured data and unstructured data like social media. Users can analyse this information to gain insights into how the business is performing.
Business intelligence helps organizations become data-driven enterprises, improve performance and gain competitive advantage.
They can:
- Improve ROI by understanding the business and intelligently allocating resources to meet strategic objectives.
- Unravel customer behavior, preferences and trends, and use the insights to better target prospects or tailor products to changing market needs.
- Monitor business operations and fix or make improvements on an ongoing basis, fueled by data insights.
- Improve supply chain management by monitoring activity up and down the line and communicating results with partners and suppliers.
The best BI software supports this decision-making process by:
- Connecting to a wide variety of different data systems and data sets including databases and spreadsheets.
- Providing deep analysis, helping users uncover hidden relationships and patterns in their data.
- Presenting answers in informative and compelling data visualizations like reports, maps, charts and graphs.
- Enabling side-by-side comparisons of data under different scenarios.
- Providing drill-down, drill-up and drill-through features, enabling users to investigate different levels of data.
SOLUTIONS
Planning, Budgeting & Forecasting
Create and analyze sophisticated plans, budgets and forecasts based on business process with small to large data sets. Integrated scorecards and strategy management – Model metrics to measure progress toward objectives and link them dynamically to actions and forecasts.
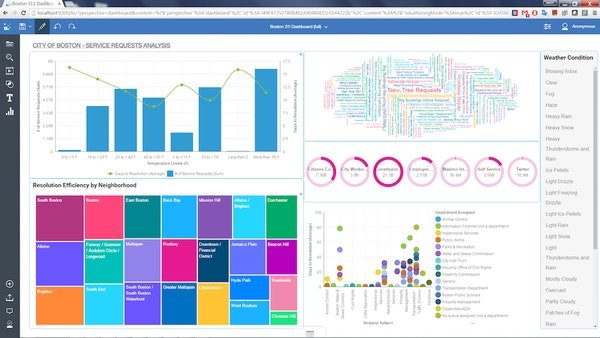
Business Intelligence Reports & Dashboards
Business Intelligence integrates reporting, modeling, analysis, dashboards, stories, and event management so you can understand your organization’s data, and make effective business decisions.
Financial Consolidation
Financial Consolidation & Reporting supports the close, consolidation and reporting process with the agility and affordability of an integrated solution.It also helps finance teams deliver financial results, create informative financial and management reports and provide the Chief Financial Officer (CFO) with an enterprise view of key financial ratios and metrics.
Data Management (ETL & DWH)
A data warehouse, or enterprise data warehouse (EDW), is a system that aggregates data from different sources into a single, central, consistent data store to support data analysis, data mining, artificial intelligence (AI), and machine learning. Simplifies ongoing integration tasks and new app development. Ensure consistent master information across transactional and analytical systems. Addresses key issues such as latency and data quality feedback proactively rather than “after the fact” in the data warehouse. Data warehouses are solely intended to perform queries and analysis and often contain large amounts of historical data.
Financial and Operational KPI’s
KPI is a quantifiable value expressing the business performance in a shorter time-frame level. They are used in different industries to track organizational processes, improve efficiency and help businesses to understand and reflect on the outcomes. When a business is measuring the effectiveness of a process, often metrics and KPIs are established to perform the evaluation and analysis.
Performance Management
Gain value with the most complete cloud: Comprehensively address your needs with functional breadth and depth across financial and operational planning, consolidation and close, master data management, and more.
2020 © All rights reserved by 1Direction Global.